I’ve shown you the hypergraph. It is space... and everything in space.

And I’ve shown you the multiway graph. It’s every possible evolution of the hypergraph.

Now I’m going to show you the causal graph. It captures the causal connections between every possible event in the evolution of the hypergraph.

Wait a minute.
That sounds complicated.
Do we really need another graph?
Aren’t the hypergraph and the multiway graph enough?
Isn’t adding an even more abstract graph to this ever-expanding set of ever-more-abstract graphs adding abstraction for the sake of abstraction?
Well, no.
The causal graph is at the core of Wolfram Physics.
It’s crucial to the derivations of Special Relativity, General Relativity and Quantum Mechanics.
And if that’s not enough to convince you that you need to know about the causal graph, how about this:
The causal graph is a reflection of the nature of causality, the nature of objectivity, the nature of reality itself.
—
Let’s start with the multiway graph.
This multiway graph shows every possible evolution of the universe over three computations:
At each computation, we’re applying the rule I’ve used many times before, the one where you find two edges from the same node, delete one of those edges, and create a new edge from each of the three nodes to a new node:

The universe, remember, is a hypergraph.
From this initial state of the universe, this initial hypergraph:

we can apply our rule in two ways:
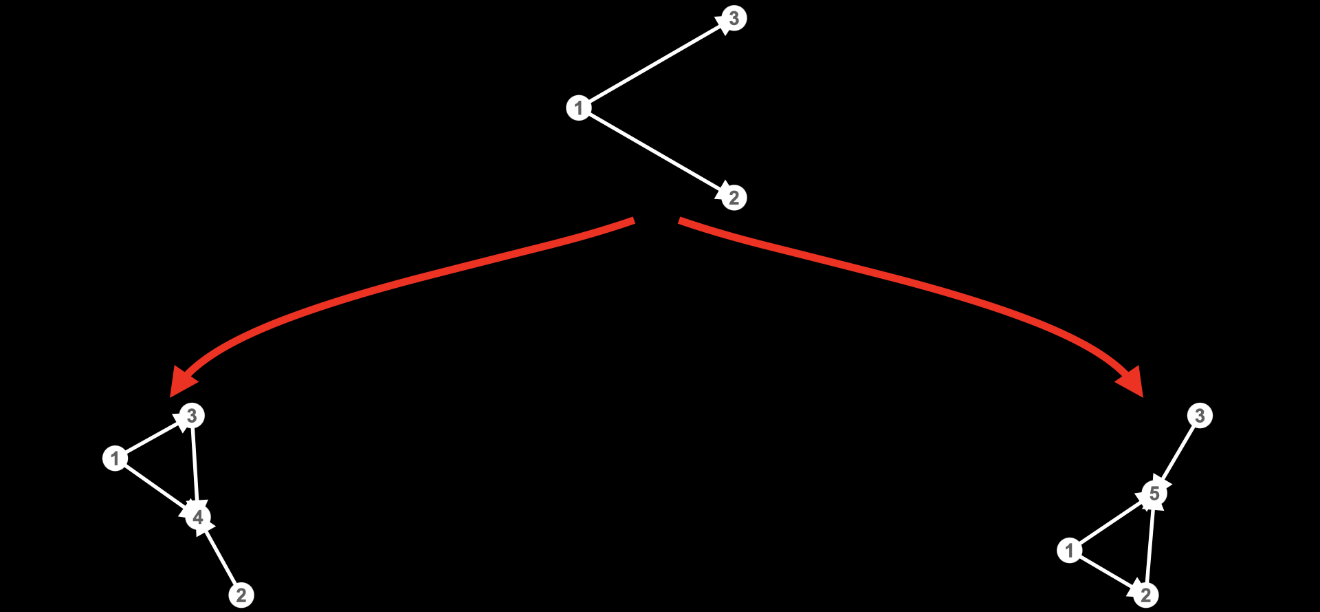
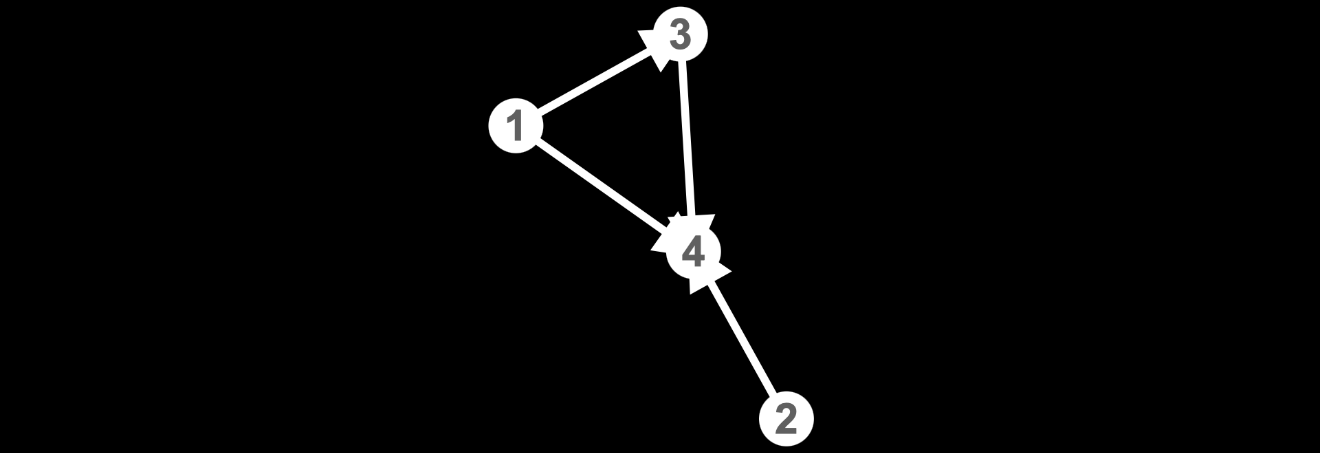
Applying it one way deletes the edge from node 1 to node 2 and creates a new node 4:
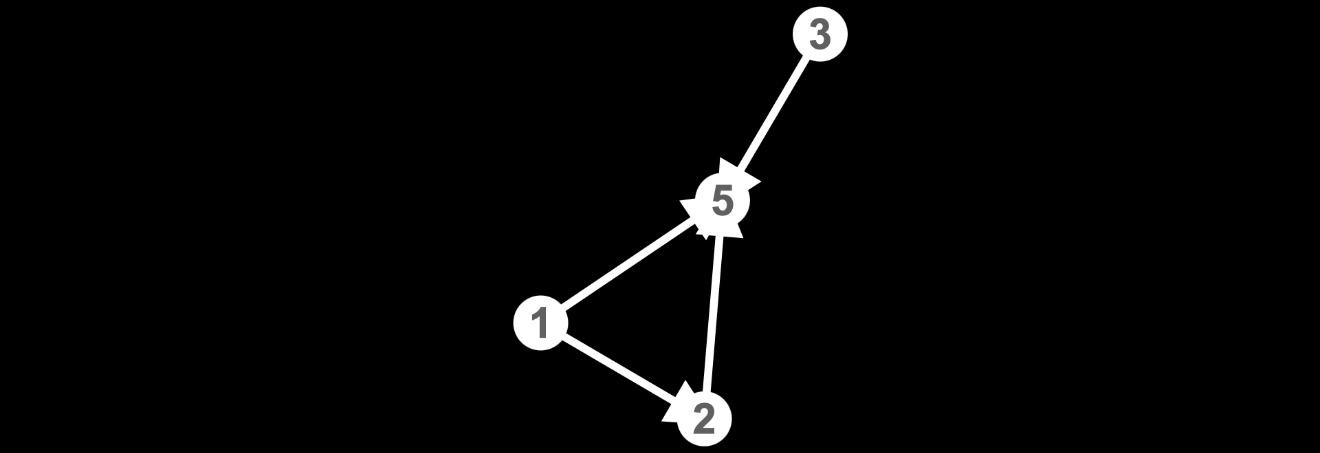
Applying it the other way deletes the edge between nodes 1 and 3 and creates a new node 5:
At the next computation, from each of these two possible states of the universe, we can apply the rule in two ways, giving us four different states:
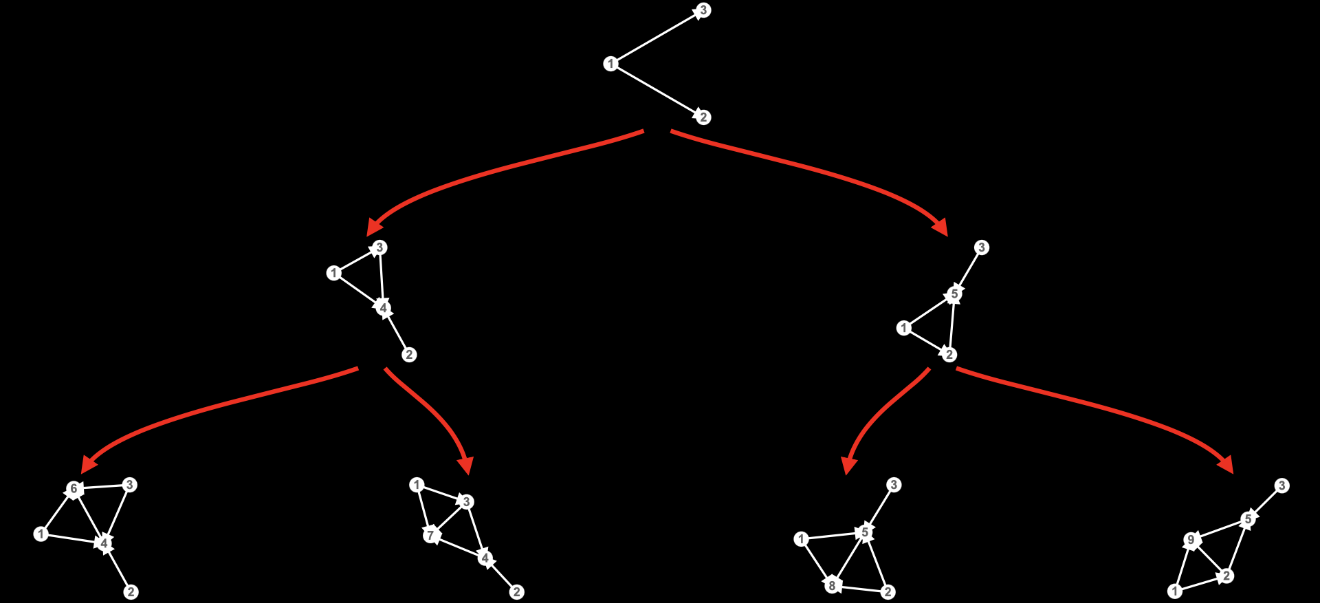
And at the next computation, from each of these four possible states of the universe, we can apply the rule in four different ways, giving us sixteen different states of the universe:
So that’s the multiway graph.
Now let’s radically shift our perspective.
Eventful
Until now, we’ve focused on the universe: this state of the universe evolves to this state of the universe evolves to this state of the universe evolves to this state of the universe.
And it’s natural for us to focus on the universe. After all, the universe is where we live.
But now I want to shift our perspective, from the universe – the hypergraph that is space and everything in space – to the events that take us from one state of the universe to another state of the universe.
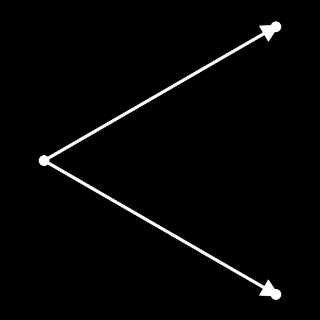
In earlier articles, I’ve talked about these events. They’re the computations, the applications of rules that turn one hypergraph into another hypergraph:
 →
→  →
→  →
→
 →
→  →
→ 
But I haven’t shown these events.
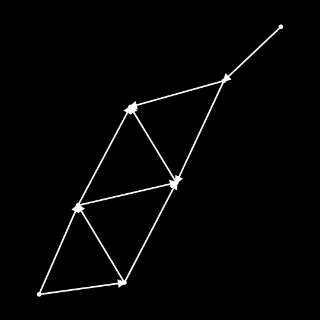
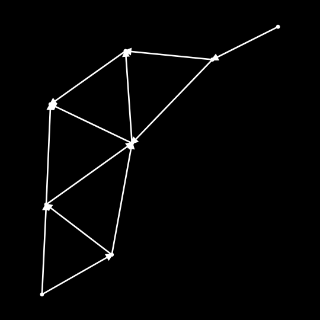
On the multiway graph, for example, I’ve drawn the hypergraphs, and I’ve drawn the red arrows that represent the transitions from one hypergraph into another hypergraph:
but I haven’t shown the events in which these transitions happen.
So let’s do that.
Let’s show the events.

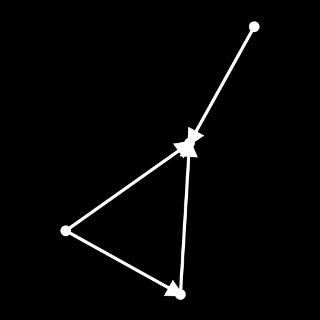
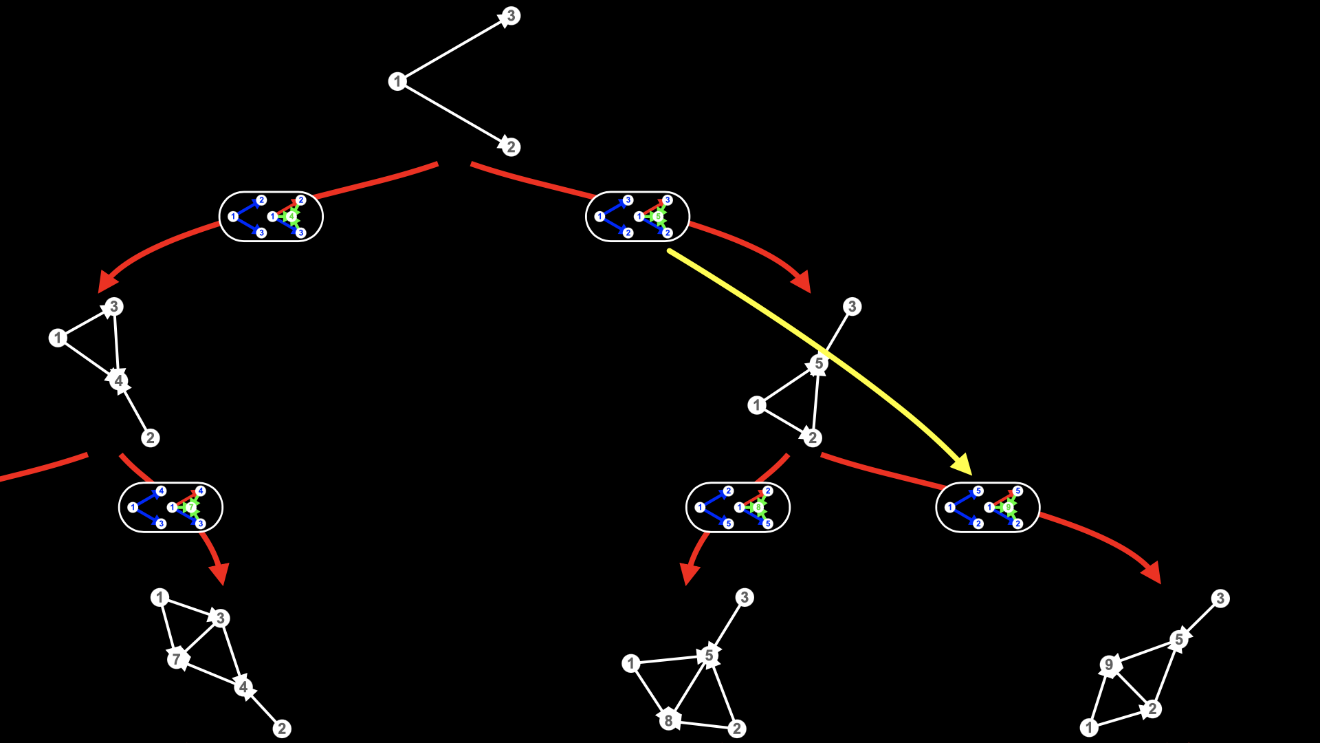
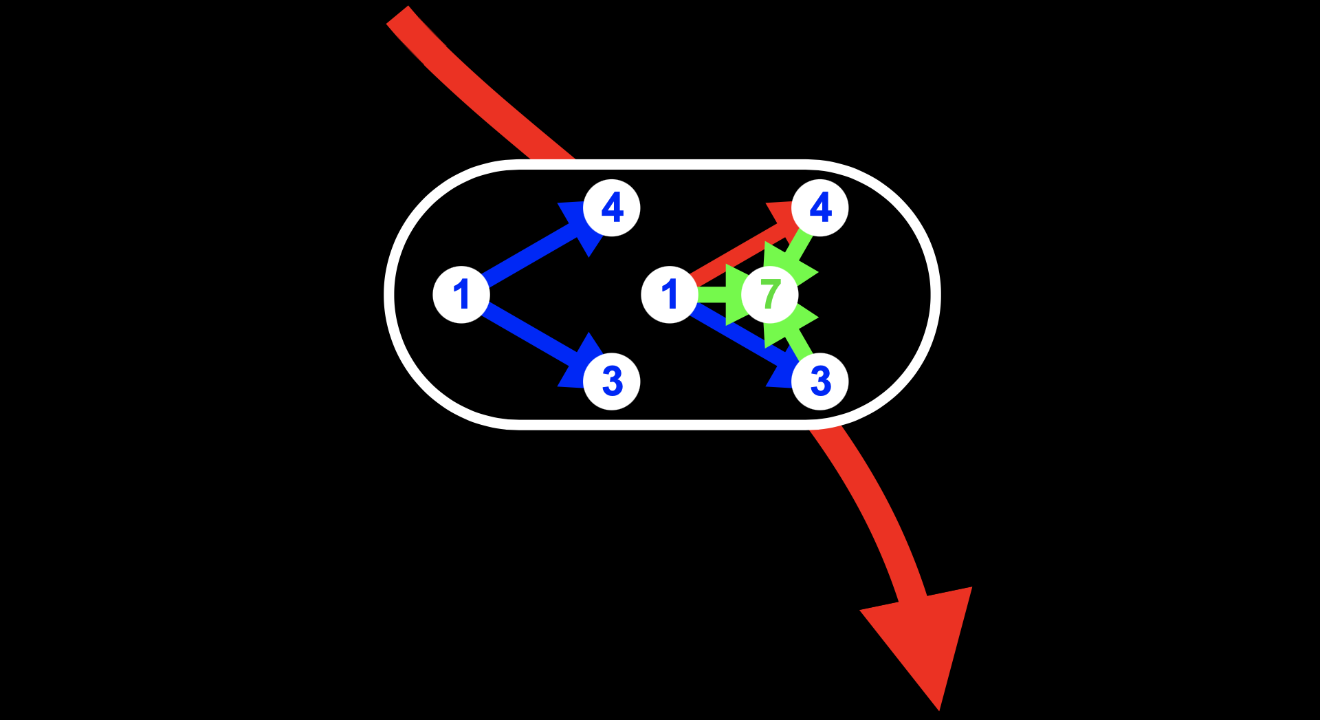
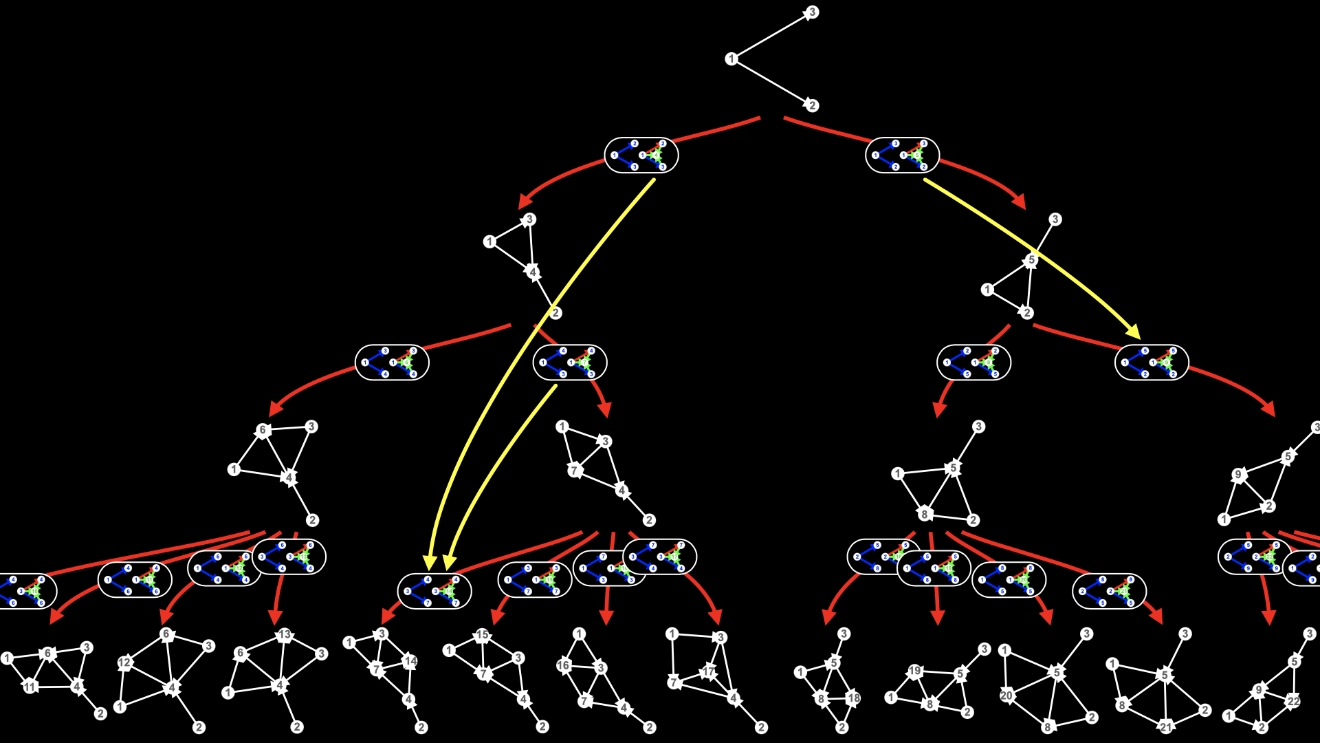
For each of the red arrows – each of the transitions from one hypergraph into another hypergraph – I’ve added an event.
Inside a white oblong, I’ve shown the edges matched, created and deleted by the rule.
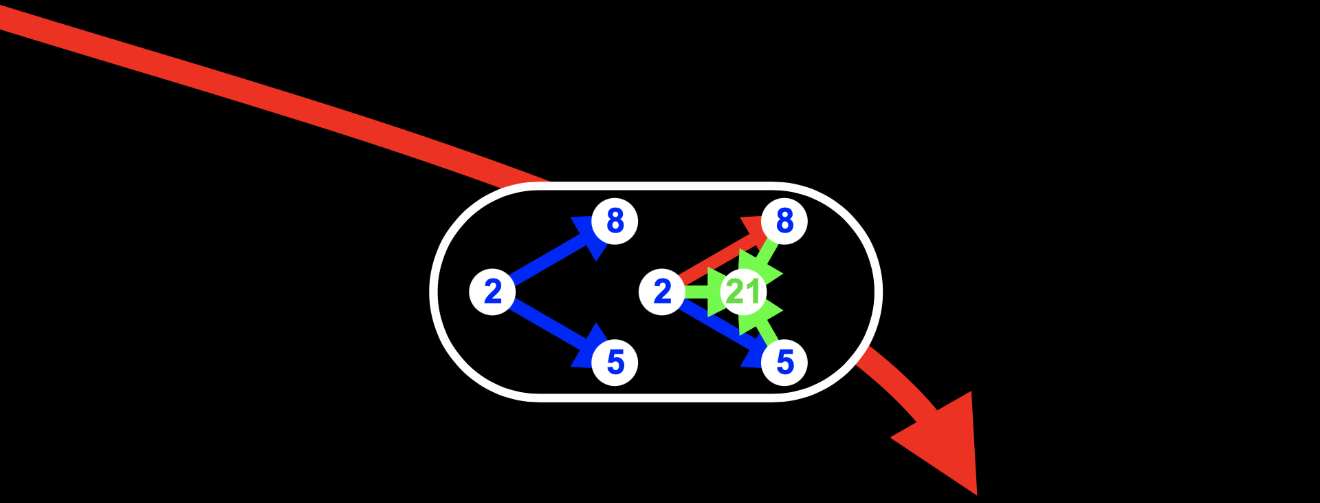
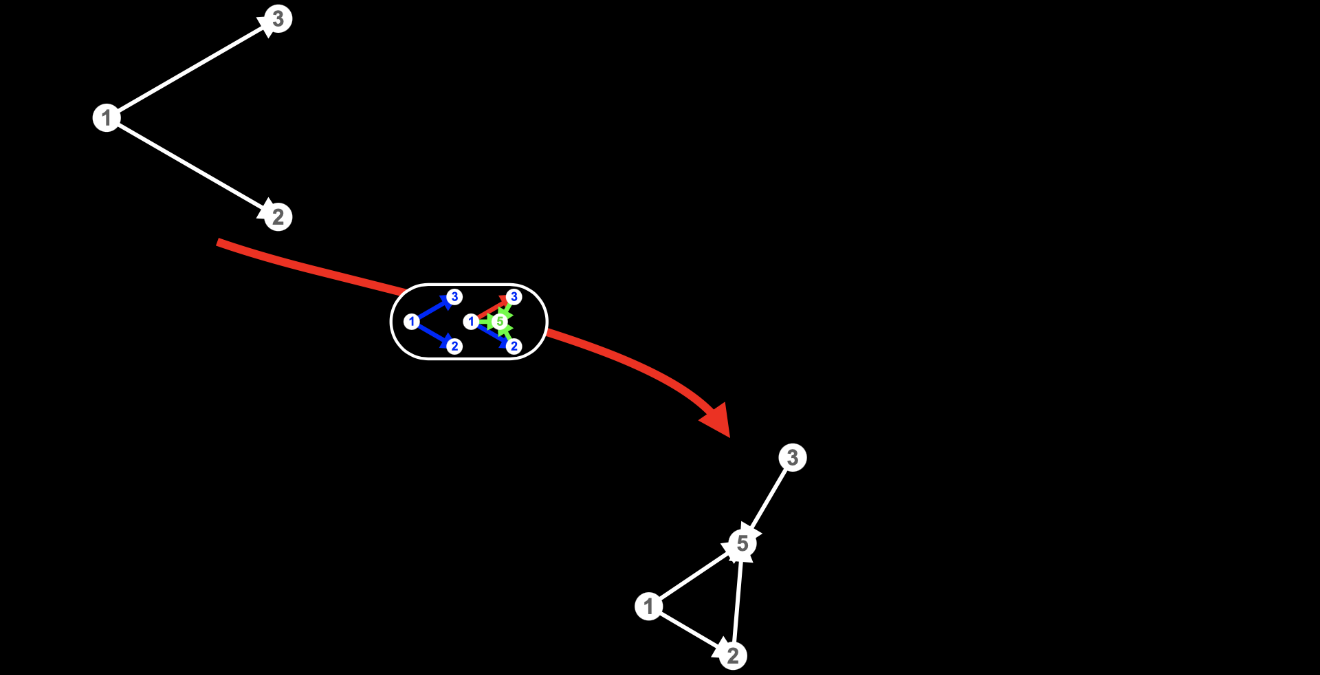
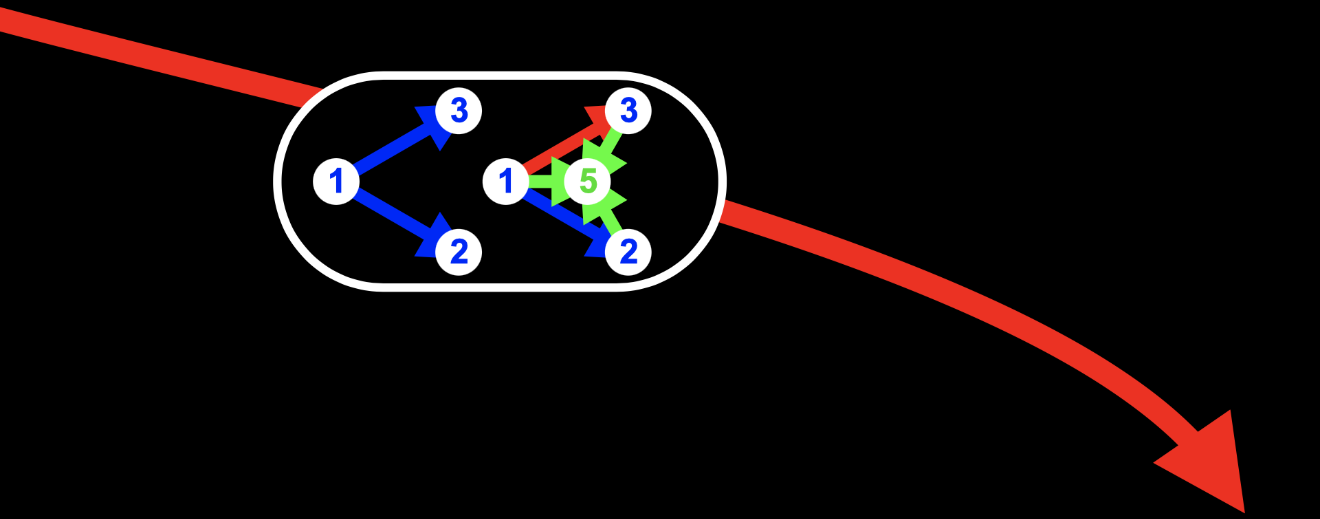
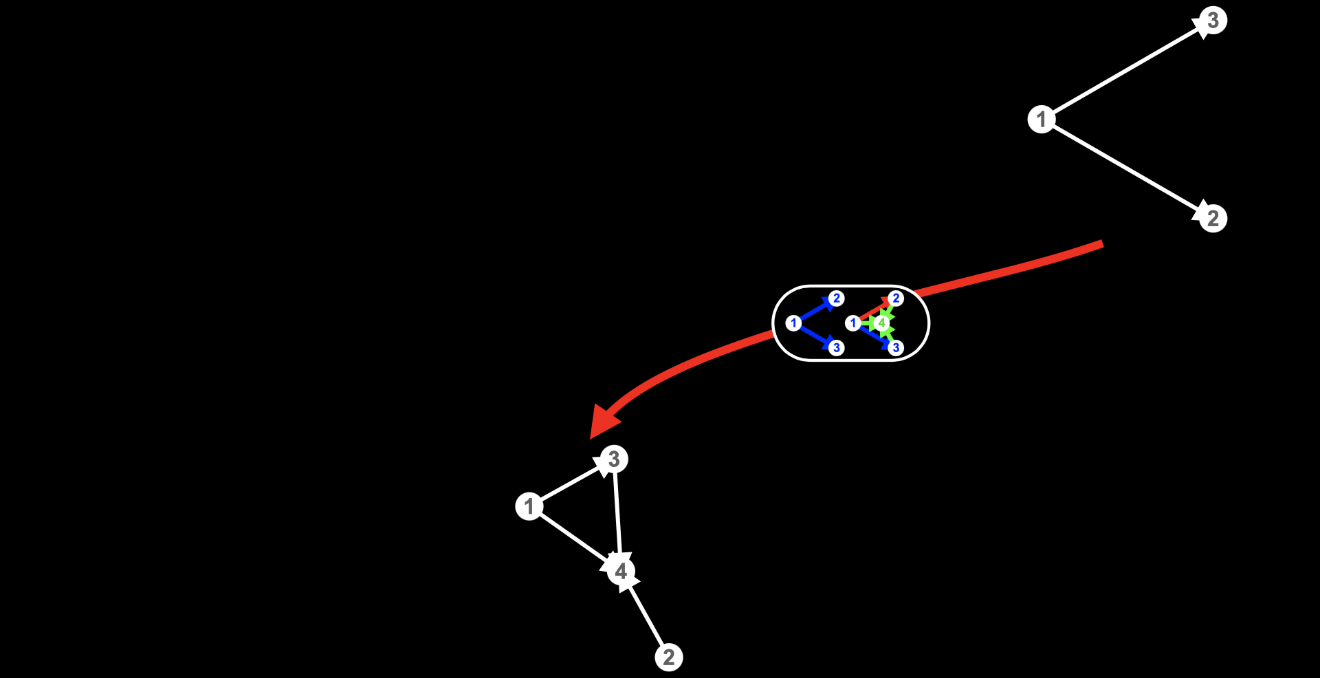
Take this event:
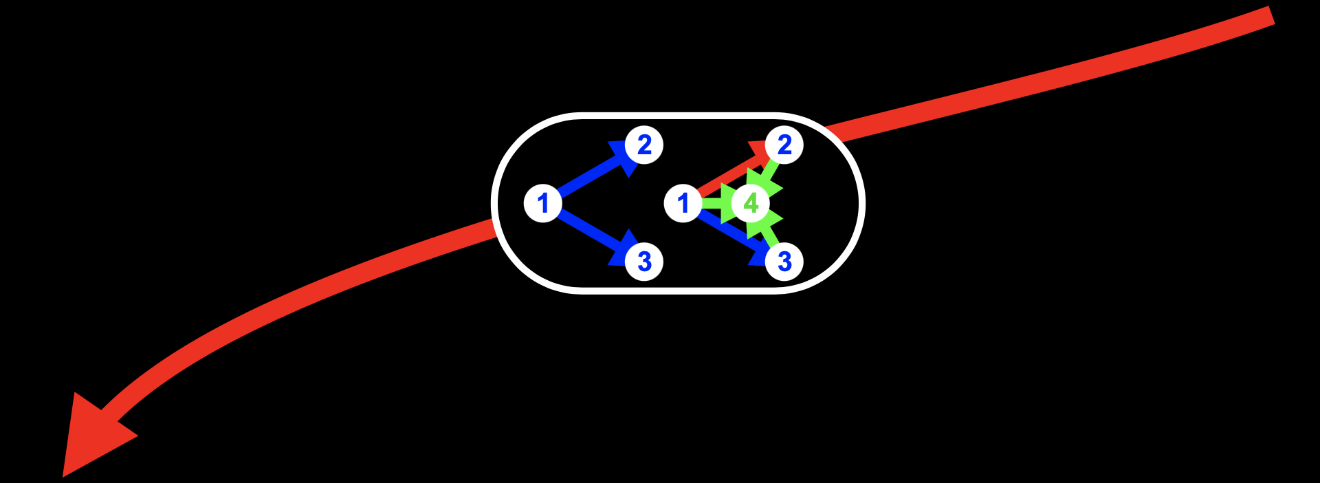
It’s the one that takes us from the initial state of the universe:

to this next state of the universe:

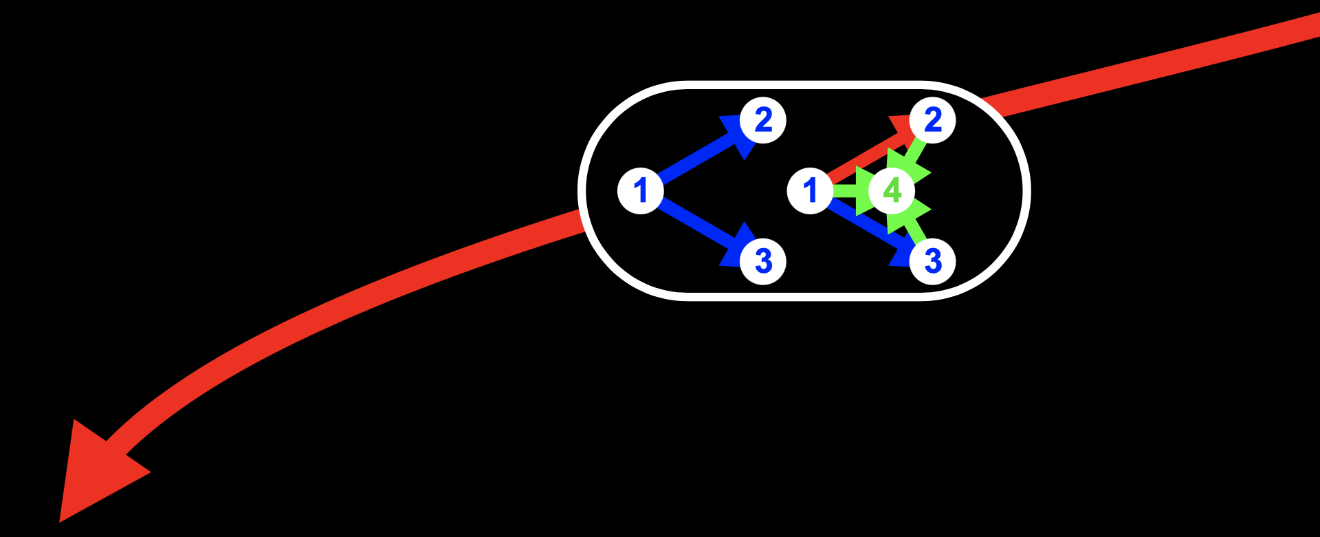
You can see that I’ve captured this application of the rule inside the white event oblong:
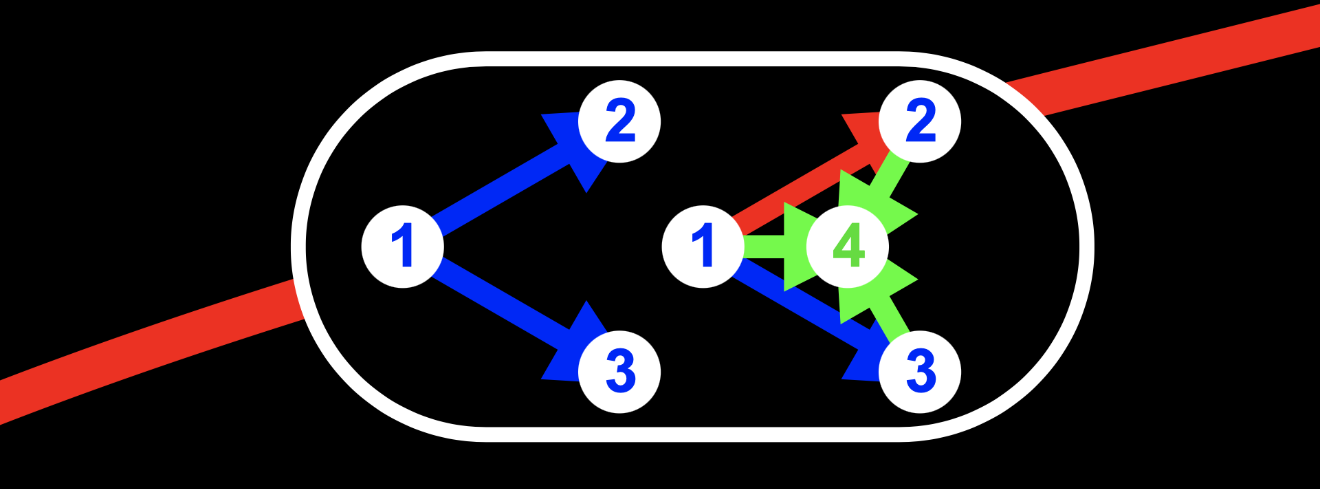
The mini-hypergraph on the left shows which edges are matched by the rule: the edge from node 1 to node 2 and the edge from node 1 to node 3.
And the mini-hypergraph on the right shows which edges are created and deleted by the rule: the edge from node 1 to node 3, shown in blue, remains as is; the edge from node 1 to node 2, shown in red, is deleted; and the edges from nodes 1, 2 and 3 to the new node 4, shown in green, are created.
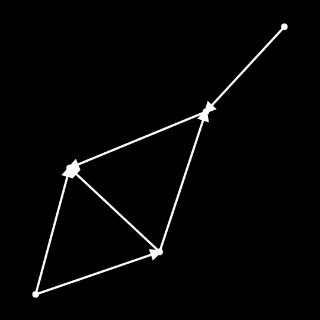
Let’s take another example.
This event:
changes this hypergraph:
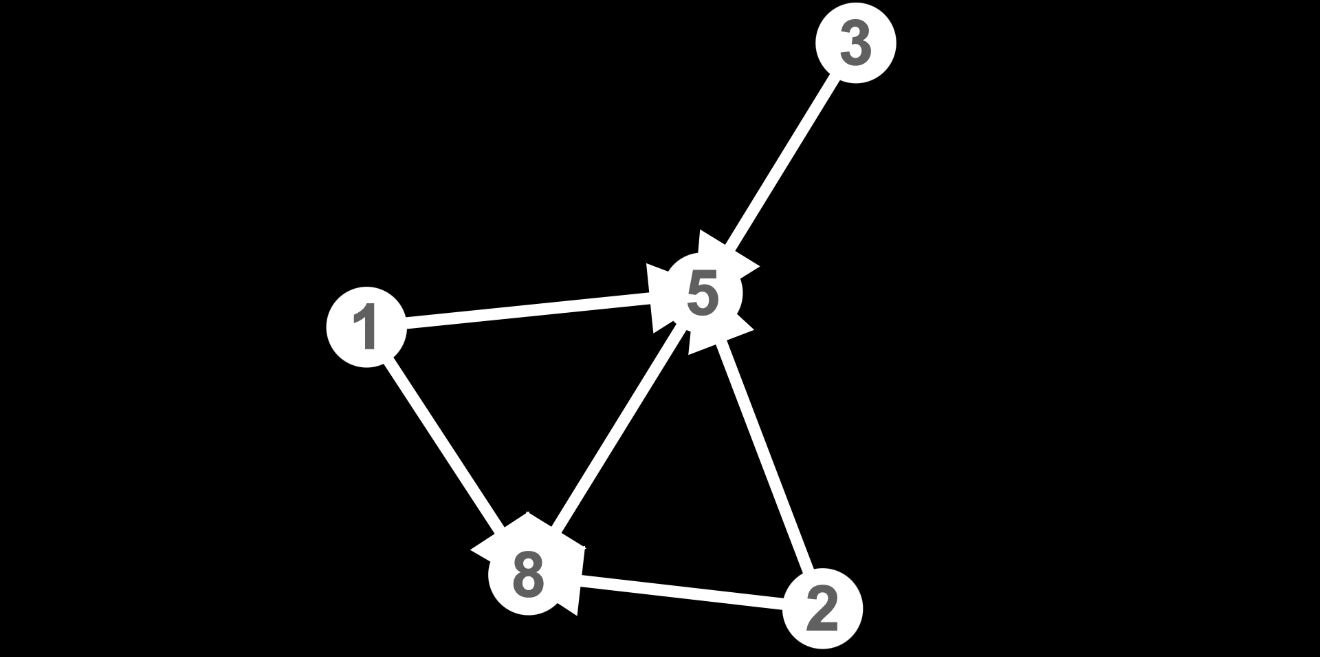
into this hypergraph:
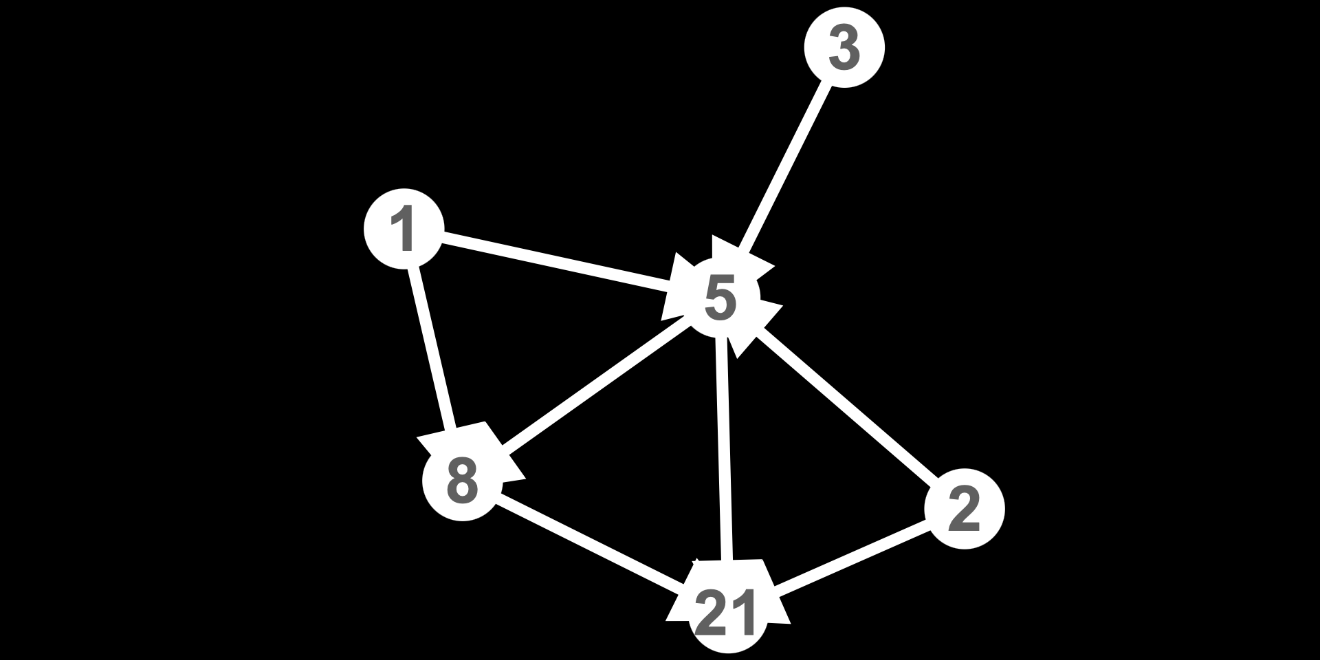
Again, I’ve captured this application of the rule inside the white event oblong:
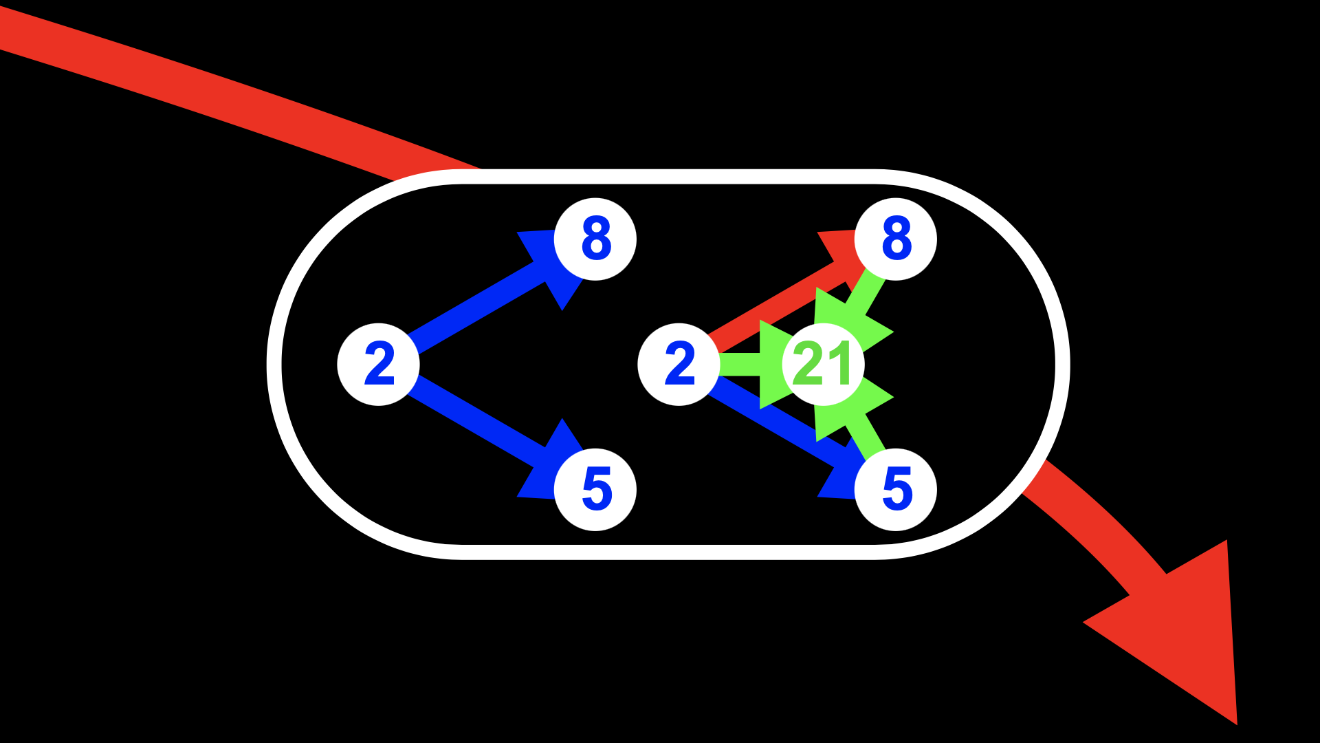
Again, the mini-hypergraph on the left shows which edges are matched by the rule: in this case, the edge from node 2 to node 8 and the edge from node 2 to node 5.
And again, the mini-hypergraph on the right shows which edges are created and deleted by the rule: in this case, the edge from node 2 to node 5 remains as is; the edge from node 2 to node 8 is deleted; and the edges from nodes 2, 5 and 8 to the new node 21 are created.
I’ve shown each of the other events in the same way, with a white oblong capturing the details of the application of the rule:
One thing leads to another
Now let’s complete our shift in perspective.
Until now, we’ve focused on which hypergraph follows which other hypergraph.
Let’s change our focus to which event follows which other event.
To be precise, let’s take a look at which events have to happen before which other events can happen.
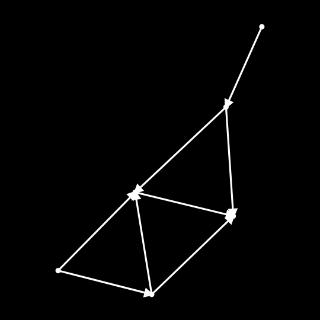
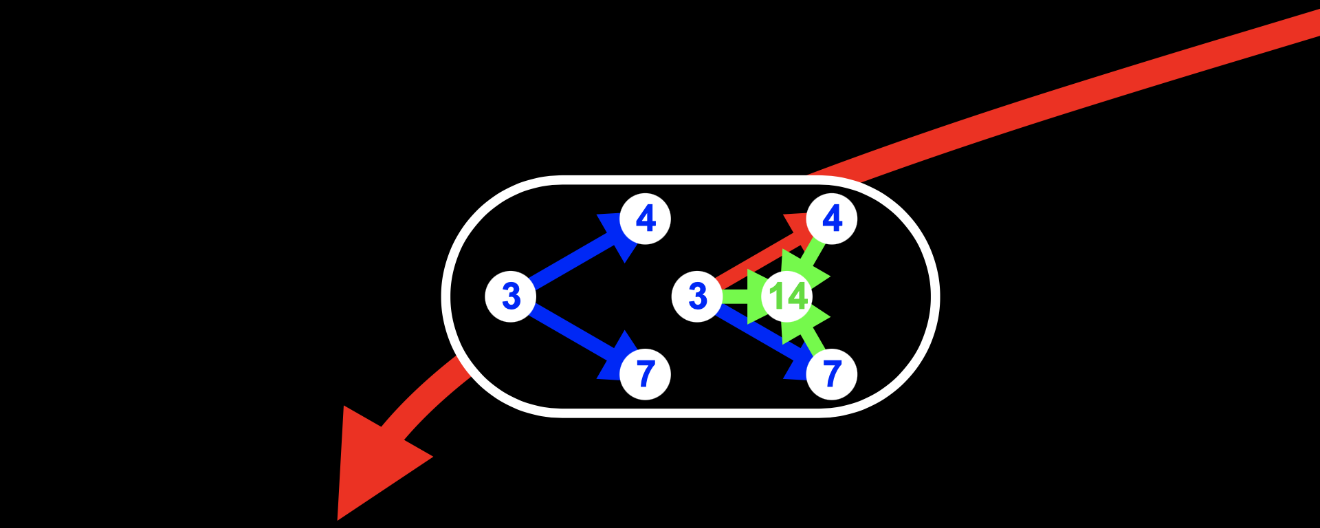
Take this event:
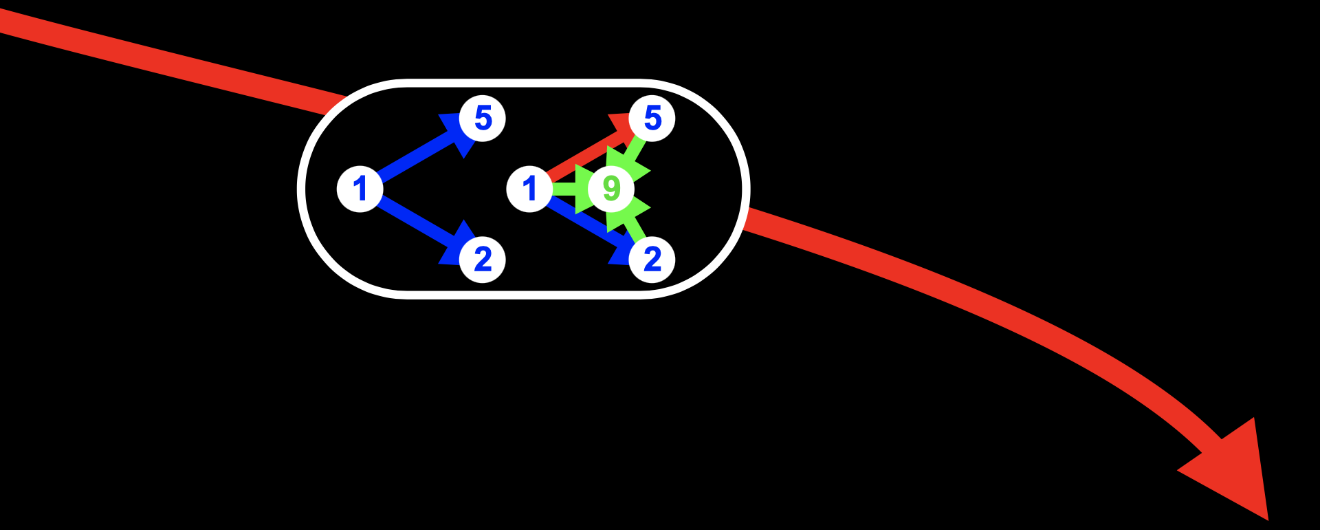
Let’s call it event 9, since it’s the event that creates node 9.
As you can see, it matches the edge from node 1 to node 5 and the edge from node 1 to node 2.
Here’s the thing.
This event can’t happen unless those edges exist.
So let’s take a look at how those edges came to exist.
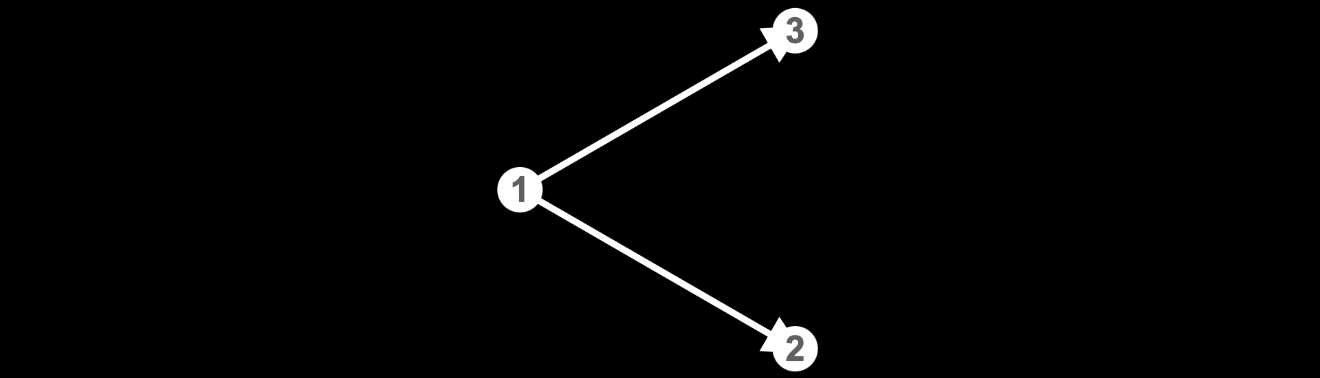
The edge from node 1 to node 2 existed from the start. It’s there in the initial state of the universe:
But the edge from node 1 to node 5 didn’t exist at the beginning of time. It was created by one of the applications of the rule to the initial state of the universe:
In other words, it was created by this event:
Let’s call this one event 5, since it’s the event that creates node 5.
Event 5 has to happen before event 9, because event 9 matches the edge from node 1 to node 5, which doesn’t exist until event 5 creates it.
So I’m going to add a yellow arrow from event 5 to event 9:
All this yellow arrow means is that event 5 has to happen before event 9.
OK, that was a lot.
Let me run through another example, just to make sure we’ve got it.
Take this event:

We can call it event 14, since it’s the event that creates node 14.
It matches the edge from node 3 to node 4 and the edge from node 3 to node 7.
Event 14 can’t happen unless those edges exist.
The edge from node 3 to node 4 was created by this application of the rule:
In other words, it was created by this event:
We’ll call it event 4, since it’s the event that creates node 4.
Event 4 has to happen before event 14, because event 14 matches the edge from node 3 to node 4, which doesn’t exist until event 4 creates it.
So I’m going to add a yellow arrow from event 4 to event 14:
OK, let’s go back to event 14.
The other edge that has to exist before event 14 can happen is the edge from node 3 to node 7.
That edge was created by this application of the rule:
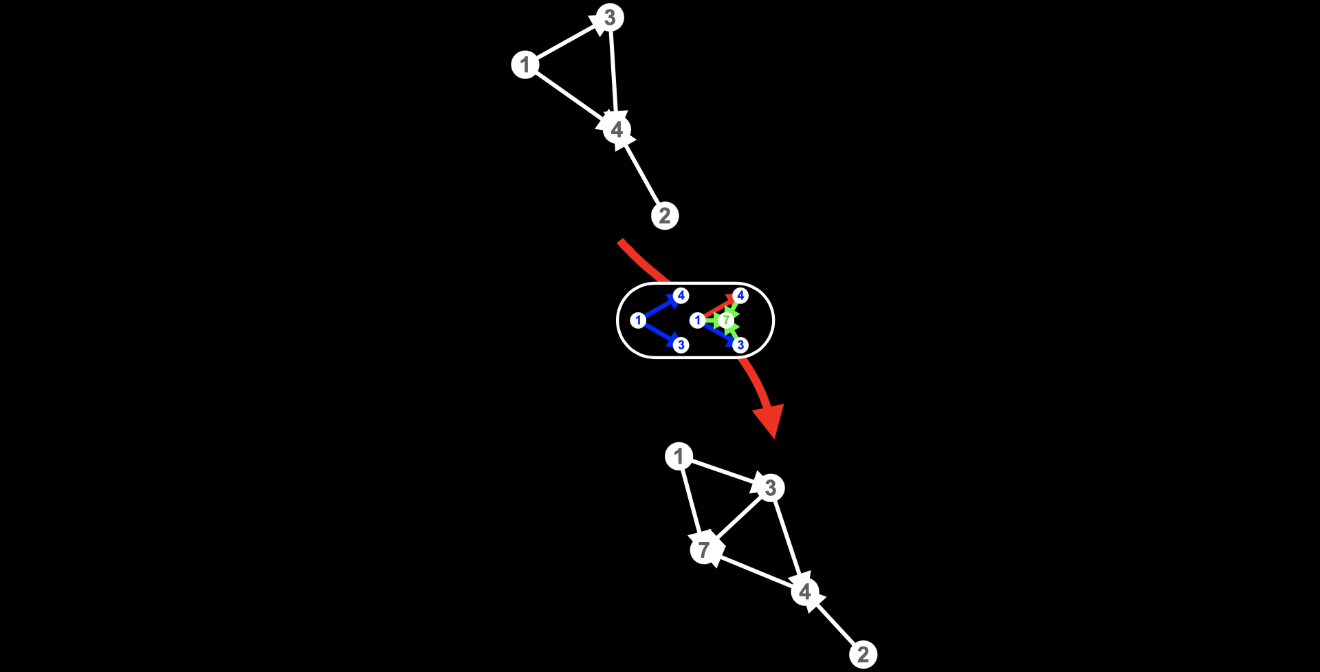
In other words, it was created by this event:
As ever, we’ll call it event 7, since it’s the event that creates node 7.
Event 7 has to happen before event 14, because event 14 matches the edge from node 3 to node 7, which doesn’t exist until event 7 creates it.
So I’m going to add a yellow arrow from event 7 to event 14:
We now have two yellow arrows to event 14, one from event 4 and the other from event 7:
All this means is that both event 4 and event 7 have to happen before event 14 can happen.
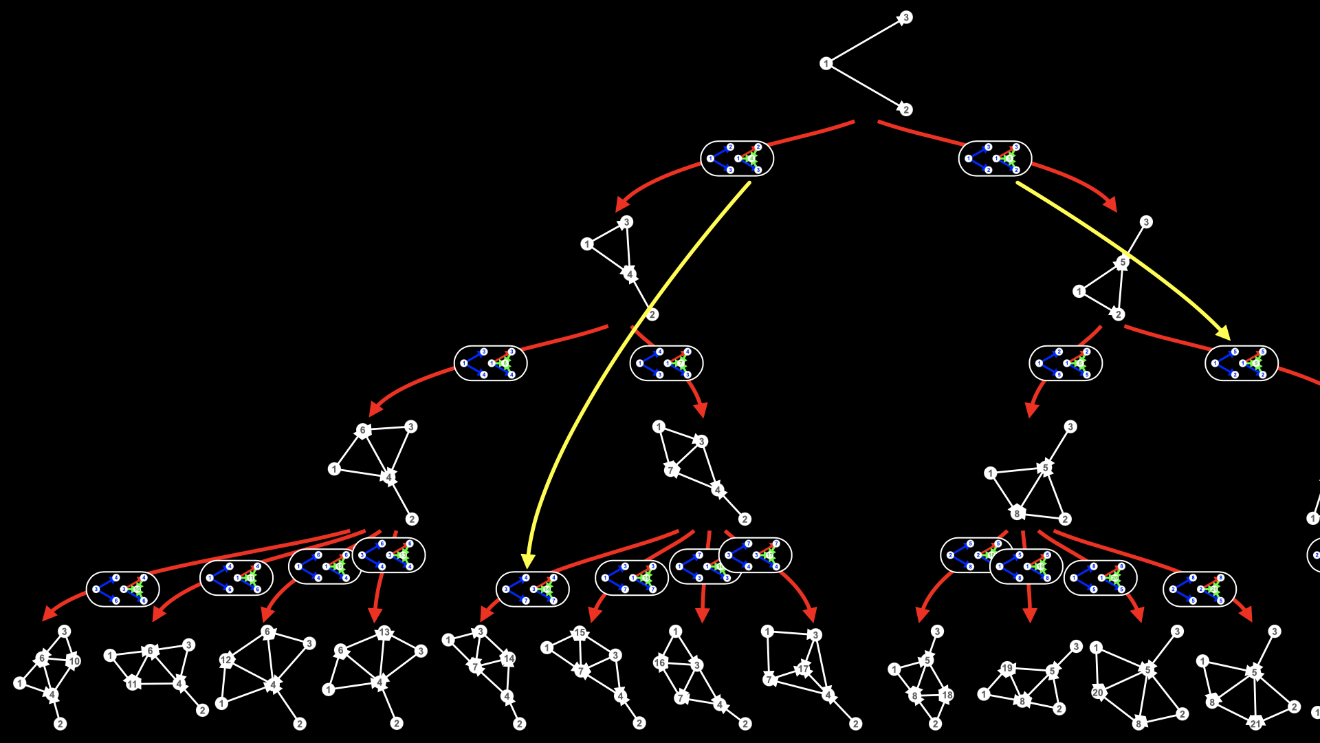
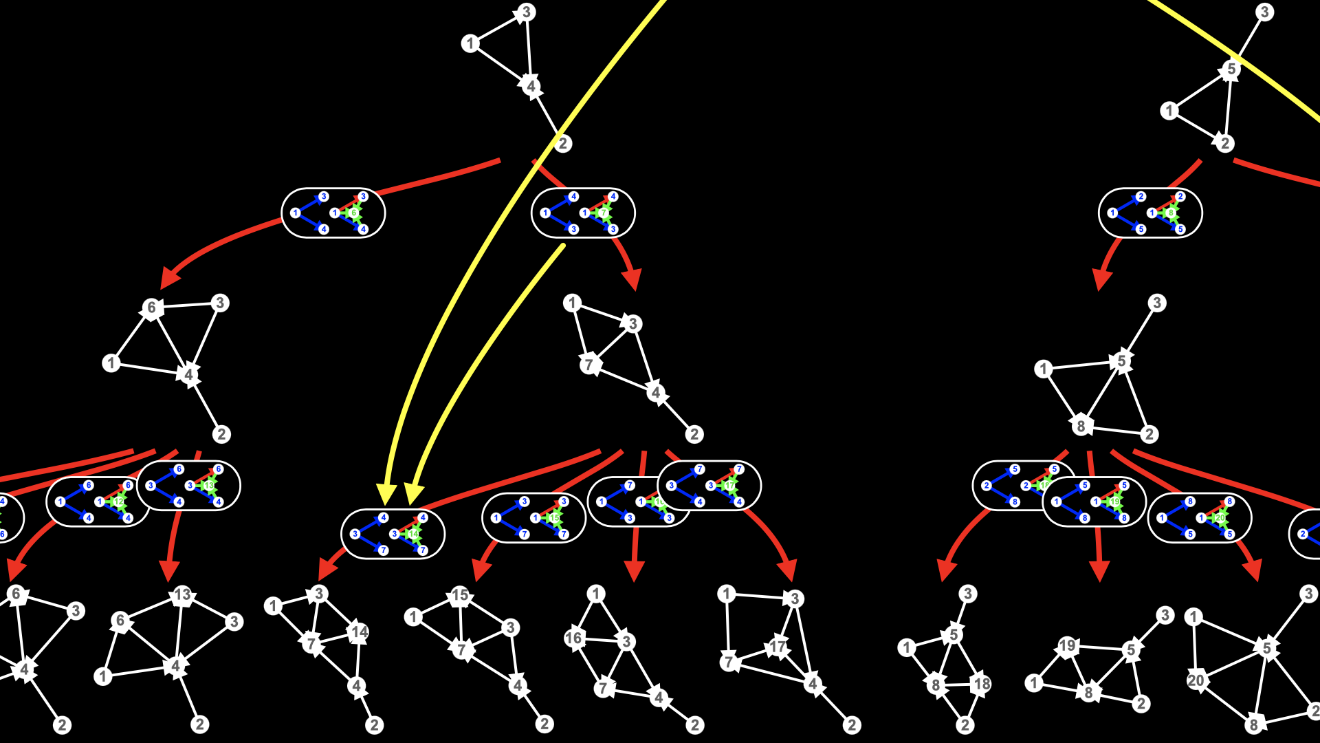
I can add yellow arrows for all the events in the multiway graph:

And I can complete the shift in perspective by removing the hypergraphs, connected by the red arrows, leaving only the events, connected by the yellow arrows:
So there it is.
Now we’re focused on events.
Now we know which events have to happen before which other events can happen.
So what?
Lost cause
Now might be a good time to mention what those yellow arrows are called.
They’re called causal edges.
They represent causal relationships between events.
The graph we’ve just created is called the causal graph.
I confess I’m a bit uncomfortable with the use of the word casual in this context.
In my earlier article Causality ain’t what you think it is, I discussed what we mean when we say the word “cause”.
Some of the things we might mean when we say the word “cause” certainly apply to the causal graph.
We can certainly say that the event at one end of the yellow arrow precedes the event at the other end.
And we can certainly say that the event at one end of the yellow arrow creates the necessary conditions for the event at the other end.
But can we really say that the event at one end of the yellow arrow causes the event at the other end?
I don’t think so.
When we say that one event causes another event, I think we mean more than merely that the one event precedes the other, more, even, than merely that the one event creates the necessary conditions for the other.
In that earlier article, I used the example of my throwing a ball into the air. When I claim that I caused the ball to fly through the air, I don’t mean merely that my moving my hand preceded the ball’s flying though the air, I don’t mean merely that my moving my hand created the necessary conditions for the ball to fly though the air, I mean that I made it happen.
This visceral concept of causality depends on our concept of self and on our concept of free will, concepts that prove chimerical when we try to pin them down.
No matter. Whether or not you believe in self, whether or not you believe in free will, the concept of causality captured in the yellow arrows of the causal graph is simple.
I’ll say it one more time: all a yellow arrow means is that one event has to happen before another event can happen.
I think this simple formulation rescues the concept of causality from oblivion.
In a world of continuous equations, there’s no role for causality.
In a world of discrete events, we can retain a limited concept of causality, according to which there is a causal relationship between two events if one event has to happen before the other event can happen.
It’s not your grandmother’s causality.
There’s no room for self or free will.
It’s reduces physics, like history, to just one thing after another.
But this limited concept of causality gives us the causal graph, which gives us, well, everything.
Meeting of the minds
It’ll take many future articles to describe how Special Relativity, General Relativity and Quantum Mechanics emerge from the causal graph.
For now, I’ll settle for a single insight from the causal graph, an insight into the nature of objectivity, indeed, the nature of reality.
Physicists have long wrestled with the question of how different observers might agree on an objective reality.
Einstein, for example, considered whether two observers, one sitting in a speeding train and the other standing on a platform as the train speeds by, would agree on whether two bolts of lightning striking the train in two different places struck at the same time or at different times.
Astonishingly, he concluded that the two observers could not agree.
Einstein did not, however, give up on objective reality.
He postulated that there’s one thing on which all observers can agree: the speed of light.
From these conjectures, Special Relativity followed.
In Wolfram Physics, we run into the same question of how different observers might agree on an objective reality.
Depending on which path they take through the multiway graph, different observers will observe different hypergraphs:
They will not agree on an objective reality.
However, if we assume causal invariance, there’s one thing on which all observers can agree: which events have to happen before which other events can happen:
From the causal graph, all of physics follows.